

Ever looked at a stock chart and felt like you were deciphering ancient hieroglyphics? All those lines and squiggles can be intimidating, especially when you're just starting out. But don't worry, there's a tool that can help you cut through the noise and see the underlying trends: moving averages.
Many beginners feel lost when first encountering the world of technical analysis. They struggle to understand how to interpret charts, identify entry and exit points, and separate meaningful signals from random fluctuations. The complexity of indicators and trading strategies can be overwhelming, leading to confusion and potentially costly mistakes.
This post is your guide to understanding and using moving averages, even if you're a complete beginner. We'll break down what they are, how they work, and how you can use them to make more informed trading decisions. We'll skip the complicated jargon and focus on practical application. Let's demystify moving averages and turn them into a valuable tool in your trading arsenal.
Moving averages are a cornerstone of technical analysis, used to smooth out price data and identify trends. They are lagging indicators, meaning they react to past price action. Common types include Simple Moving Averages (SMA) and Exponential Moving Averages (EMA). These averages help traders to filter out the noise of short-term price fluctuations and get a clearer view of the overall direction of the market. By understanding how to interpret these lines, you can gain valuable insights into potential support and resistance levels, as well as identify potential buy and sell signals. Learning about moving averages will give you a strong start in technical analysis and can ultimately improve your trading strategies.
How to Choose the Right Moving Average Period
Choosing the right period for your moving average is a crucial step that significantly impacts its effectiveness. It's something I personally struggled with when I first started trading. I remember trying to use a 200-day moving average for day trading – needless to say, it didn't work! The signals were far too slow to react to the rapid price movements. That experience taught me that the period length needs to align with your trading style and the timeframe you're analyzing.
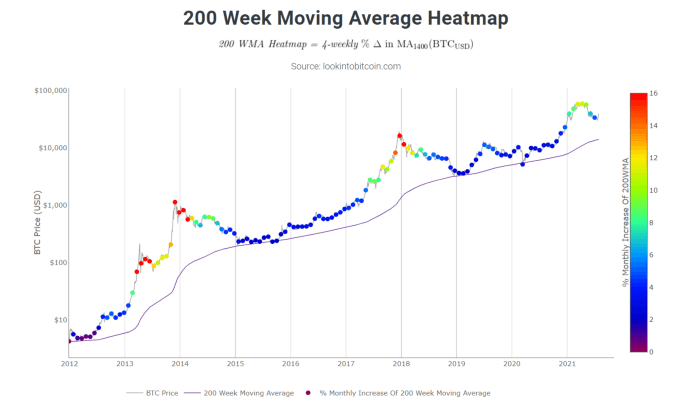
Think of it this way: a shorter period, like a 20-day moving average, will react quickly to price changes, making it suitable for short-term trading or identifying immediate trends. However, it's also more susceptible to whipsaws and false signals. On the other hand, a longer period, like a 200-day moving average, will smooth out the price action more significantly, making it better for identifying long-term trends. It's less sensitive to short-term noise but also slower to react to trend changes.
The best approach is to experiment and find what works best for you and the specific assets you're trading. Consider your trading timeframe, your risk tolerance, and the volatility of the asset. Don't be afraid to try different periods and backtest your strategies to see which ones generate the most consistent results. Also, remember that the "right" period isn't set in stone; it may need to be adjusted as market conditions change. By understanding the nuances of moving average periods, you can tailor your analysis to achieve your specific trading goals when you How to Use Moving Averages as a Beginner.
Understanding Simple Moving Averages (SMA)
A Simple Moving Average (SMA) is arguably the most basic and widely used type of moving average. It’s calculated by taking the average of the closing prices for a specified number of periods. For example, a 50-day SMA would average the closing prices of the last 50 days. This calculation creates a smoothed line that represents the average price over that period, helping to filter out the short-term fluctuations and highlight the underlying trend.
The key concept to grasp with SMAs is that each data point has equal weight in the calculation. Whether it's the most recent closing price or the closing price from 50 days ago, they all contribute equally to the final average. This makes the SMA relatively simple to calculate and understand. However, it also means that older data points have just as much influence as recent data points, which can be a drawback when you want the moving average to be more responsive to recent price action.
Despite its simplicity, the SMA is a powerful tool for identifying trends and potential support and resistance levels. When the price is consistently above the SMA, it suggests an uptrend. Conversely, when the price is consistently below the SMA, it suggests a downtrend. Traders often use SMAs in conjunction with other indicators to confirm their trading decisions. While more sophisticated moving averages exist, understanding the SMA is fundamental to mastering technical analysis and How to Use Moving Averages as a Beginner.
The History and Myths of Moving Averages
The use of moving averages dates back to the early days of technical analysis, with roots tracing back to the late 19th and early 20th centuries. While the exact origin is debated, many attribute its formalization to the development of bar charts and the need to visually identify trends in stock prices. The initial intention was to smooth out price fluctuations and get a clearer picture of the underlying market sentiment, without the aid of today's sophisticated computing power.
One of the biggest myths surrounding moving averages is that they are foolproof predictors of future price movements. It's crucial to remember that they are lagging indicators, meaning they reflect past price action and cannot guarantee future performance. Relying solely on moving averages without considering other factors can lead to false signals and potentially costly mistakes. Another common misconception is that there is one "perfect" moving average period that works for all assets and market conditions. The reality is that the optimal period depends on the specific asset, trading timeframe, and market volatility.
Understanding the history and dispelling the myths surrounding moving averages is essential for using them effectively. By recognizing their limitations and incorporating them into a broader trading strategy, traders can leverage the power of moving averages without falling prey to unrealistic expectations when they How to Use Moving Averages as a Beginner. It is crucial to always remember that no single indicator can guarantee profits.
The Hidden Secret of Moving Averages: Confirmation
While moving averages are often used to identify trends and potential entry points, their hidden secret lies in their ability to provideconfirmation. They don't just tell you what might be happening; they can help you validate your existing ideas and reduce the risk of acting on false signals. Imagine you're seeing a potential breakout on a stock chart. Instead of jumping in immediately, you can use a moving average to confirm that the breakout is likely to be genuine and not just a temporary blip.
For example, if the price breaks above a key resistance level and also closes above its 50-day moving average, it provides stronger confirmation that the breakout is likely to be sustained. Conversely, if the price breaks below a support level but the 50-day moving average is still trending upwards, it might suggest that the breakdown is temporary and the price is likely to rebound. This confirmation aspect can significantly improve your trading accuracy and reduce your exposure to false breakouts and breakdowns.
Furthermore, moving averages can be used to confirm divergences between price action and momentum. If the price is making new highs but the moving average is failing to do so, it could indicate a weakening trend and a potential reversal. By understanding and utilizing the confirmation aspect of moving averages, you can add a valuable layer of protection to your trading strategies and significantly improve your overall performance when you How to Use Moving Averages as a Beginner.
Recommendations on How to Use Moving Averages
If you're serious about incorporating moving averages into your trading strategy, here's a recommendation: start with a demo account and experiment. Don't risk real money until you have a solid understanding of how different moving average periods work and how they interact with other indicators. A great place to practice your technical analysis skills is XM Broker. Their platform offers a wide range of assets and charting tools, allowing you to backtest different strategies and refine your approach without risking your capital.
Another recommendation is to focus on mastering a few key moving average strategies rather than trying to learn everything at once. For example, you could start by learning how to identify trends using the 50-day and 200-day moving averages, and then gradually add more complex strategies as you become more comfortable. Don't be afraid to seek out educational resources and mentors who can provide guidance and feedback. There are countless books, articles, and online courses that can help you deepen your understanding of moving averages and technical analysis.
Finally, remember that consistency is key. Stick to your trading plan and avoid making impulsive decisions based on emotions. By combining knowledge, practice, and discipline, you can unlock the full potential of moving averages and achieve your trading goals. Also, be sure to understand all the risks involved and only invest what you can afford to lose as How to Use Moving Averages as a Beginner.
Moving Average Crossovers: A Deeper Dive
Moving average crossovers occur when two moving averages with different periods intersect. These crossovers are often used to generate potential buy or sell signals. The most common type of crossover involves a short-term moving average (e.g., 50-day) crossing above or below a long-term moving average (e.g., 200-day). When the short-term moving average crosses above the long-term moving average, it's known as a "golden cross" and is often interpreted as a bullish signal. Conversely, when the short-term moving average crosses below the long-term moving average, it's known as a "death cross" and is often interpreted as a bearish signal.
However, it's important to remember that moving average crossovers are not foolproof indicators. They can generate false signals, especially in choppy or sideways markets. To improve the accuracy of crossovers, it's recommended to use them in conjunction with other indicators and technical analysis techniques. For example, you could look for confirmation from volume, momentum indicators, or price action patterns. Additionally, consider the context of the overall market trend. A golden cross in a strong uptrend is more likely to be a valid signal than a golden cross in a sideways market.
Experiment with different moving average periods to find what works best for your trading style and the specific assets you're trading. Some traders prefer to use even shorter periods, such as the 20-day and 50-day moving averages, for faster signals. Ultimately, the key is to develop a solid understanding of how moving average crossovers work and to use them judiciously as part of a comprehensive trading strategy for How to Use Moving Averages as a Beginner.
Tips on How to Use Moving Averages Effectively
Effective use of moving averages requires a thoughtful approach and a clear understanding of their strengths and limitations. One crucial tip is to avoid relying solely on moving averages for your trading decisions. They are best used in conjunction with other technical indicators and chart patterns to confirm potential signals. For example, if you see a bullish moving average crossover, look for confirmation from other indicators, such as the Relative Strength Index (RSI) or Moving Average Convergence Divergence (MACD), before entering a trade.
Another valuable tip is to adapt your moving average periods to the specific asset you're trading and the prevailing market conditions. Different assets have different levels of volatility and may require different moving average periods to generate reliable signals. Additionally, market conditions can change over time, so it's important to periodically reassess your moving average settings and adjust them as needed. Pay attention to how the moving averages are behaving relative to the price action and adjust your strategy accordingly.
Finally, be patient and avoid chasing every signal generated by your moving averages. It's better to wait for high-probability setups that align with your overall trading plan than to jump into trades based on fleeting signals. By combining knowledge, patience, and adaptability, you can maximize the effectiveness of moving averages and improve your trading results in your journey to understand How to Use Moving Averages as a Beginner.
Choosing Between SMA and EMA: Which One is Right for You?
The choice between a Simple Moving Average (SMA) and an Exponential Moving Average (EMA) depends on your trading style and the specific objectives you're trying to achieve. As we discussed earlier, the SMA calculates the average price over a specified period, giving equal weight to each data point. This makes it relatively easy to understand and use. However, it also means that the SMA can be slow to react to recent price changes, as older data points have just as much influence as newer ones.
The EMA, on the other hand, gives more weight to recent prices, making it more responsive to current market conditions. This can be an advantage for short-term traders who are looking to capitalize on quick price movements. However, it also means that the EMA can be more susceptible to whipsaws and false signals, especially in choppy markets. The key is to consider the trade-offs between responsiveness and stability when choosing between the SMA and EMA.
Ultimately, the best way to determine which type of moving average is right for you is to experiment with both and see which one generates the most consistent results for your trading style. You might even consider using both the SMA and EMA in conjunction with each other to get a more comprehensive view of the market. Consider which one you are the most familiar with as How to Use Moving Averages as a Beginner.
Fun Facts About Moving Averages
Did you know that moving averages are not just used in finance? They're also used in a variety of other fields, including weather forecasting, signal processing, and even epidemiology! In weather forecasting, moving averages are used to smooth out daily temperature fluctuations and identify long-term trends. In signal processing, they're used to filter out noise and extract meaningful information from signals. And in epidemiology, they're used to track the spread of diseases and identify outbreaks.
Another fun fact is that the concept of moving averages has been around for centuries, although it wasn't formally defined until the advent of modern statistics. Early forms of moving averages were used by astronomers to smooth out observational data and identify patterns in celestial movements. These early applications of moving averages laid the groundwork for their eventual use in finance and other fields.
Finally, moving averages are not just limited to price data. They can be applied to any time series data, such as volume, earnings, or even social media sentiment. This versatility makes them a valuable tool for analyzing a wide range of phenomena. By understanding the broader applications and history of moving averages, you can gain a deeper appreciation for their power and utility as How to Use Moving Averages as a Beginner.
How to Combine Moving Averages with Other Indicators
Combining moving averages with other technical indicators is a powerful way to enhance your trading strategies and improve the accuracy of your signals. One popular combination is to use moving averages in conjunction with momentum indicators, such as the Relative Strength Index (RSI) or Moving Average Convergence Divergence (MACD). These indicators can help you confirm the strength of a trend identified by a moving average and identify potential overbought or oversold conditions.
For example, if the price is above its 50-day moving average, indicating an uptrend, you can use the RSI to determine if the asset is overbought. If the RSI is above 70, it suggests that the asset is overbought and may be due for a pullback. In this case, you might wait for a dip before entering a long position. Similarly, if the price is below its 50-day moving average, indicating a downtrend, you can use the RSI to determine if the asset is oversold. If the RSI is below 30, it suggests that the asset is oversold and may be due for a bounce.
Another effective combination is to use moving averages with volume analysis. Volume can provide valuable insights into the strength of a trend and the level of conviction behind price movements. For example, if the price is breaking above a moving average on high volume, it suggests that the breakout is likely to be sustained. By combining moving averages with other indicators, you can create a more robust and reliable trading strategy for How to Use Moving Averages as a Beginner.
What if Moving Averages Fail?
It's important to acknowledge that moving averages, like any technical indicator, are not infallible. There will be times when they fail to generate accurate signals or provide reliable support and resistance levels. This is particularly true in volatile or choppy markets, where price action can be erratic and unpredictable. So, what should you do when moving averages fail?
The first step is to recognize that the market is not always going to behave according to your expectations. Don't get emotionally attached to your moving average strategy and be prepared to adapt when necessary. If you're consistently getting false signals from your moving averages, it might be time to reassess your settings or consider using a different strategy altogether. Remember that no single indicator is perfect, and it's important to have a flexible approach to trading.
Another important consideration is to manage your risk appropriately. Always use stop-loss orders to limit your potential losses and avoid over-leveraging your positions. Even if you have a high-confidence setup based on moving averages, there's always a chance that the market will move against you. By managing your risk effectively, you can protect your capital and ensure that you're able to continue trading even when your moving average strategies fail as How to Use Moving Averages as a Beginner.
Listicle: 5 Key Things to Remember About Moving Averages
Here's a quick listicle summarizing the key takeaways about moving averages:
- Moving Averages are Lagging Indicators: Remember that they reflect past price action and cannot predict the future.
- Choose the Right Period: The optimal period depends on your trading style and the asset you're trading.
- Confirm Signals with Other Indicators: Don't rely solely on moving averages for your trading decisions.
- Manage Your Risk: Always use stop-loss orders and avoid over-leveraging.
- Be Patient and Adaptable: The market is constantly changing, so be prepared to adjust your strategy as needed.
By keeping these key things in mind, you can use moving averages effectively and improve your trading results. Mastering this skill is paramount as How to Use Moving Averages as a Beginner.
Question and Answer About How to Use Moving Averages as a Beginner
Q: What is the difference between a Simple Moving Average (SMA) and an Exponential Moving Average (EMA)?
A: The SMA calculates the average price over a specified period, giving equal weight to each data point. The EMA gives more weight to recent prices, making it more responsive to current market conditions.
Q: How do I choose the right moving average period for my trading style?
A: The optimal period depends on your trading timeframe and the volatility of the asset you're trading. Shorter periods are better for short-term trading, while longer periods are better for long-term investing.
Q: Can I use moving averages to predict future price movements?
A: Moving averages are lagging indicators and cannot predict the future. They are best used to identify trends and potential support and resistance levels.
Q: How can I improve the accuracy of moving average signals?
A: Use moving averages in conjunction with other technical indicators, such as the RSI or MACD, and pay attention to volume and price action patterns.
Conclusion of How to Use Moving Averages as a Beginner
Moving averages are a powerful tool for traders of all levels, but particularly useful for beginners. By understanding their strengths and limitations, you can incorporate them into your trading strategy and improve your decision-making. Remember to experiment, adapt, and always manage your risk. As you gain experience, you'll develop a deeper understanding of how to use moving averages effectively and achieve your trading goals. For those looking to explore further trading strategies, consider checking out Valetax for additional resources.


0 Reviews
Your rating